


Daily Technical Analysis: Gold falls more than 6% from its all-time high

Gold falls below $3,300 following a strong rally beyond $3,500
Gold prices fell sharply last week after reaching a new all-time high at $3,500. Since then, gold ounce prices have lost 6% as the US dollar showed strength. Gold mostly traded sideways after the declines with short term moving average showing mixed signals.
Waiting for a bullish reversal from the $3,260 is recommended before confirming upward movements.
Gold 1H Chart
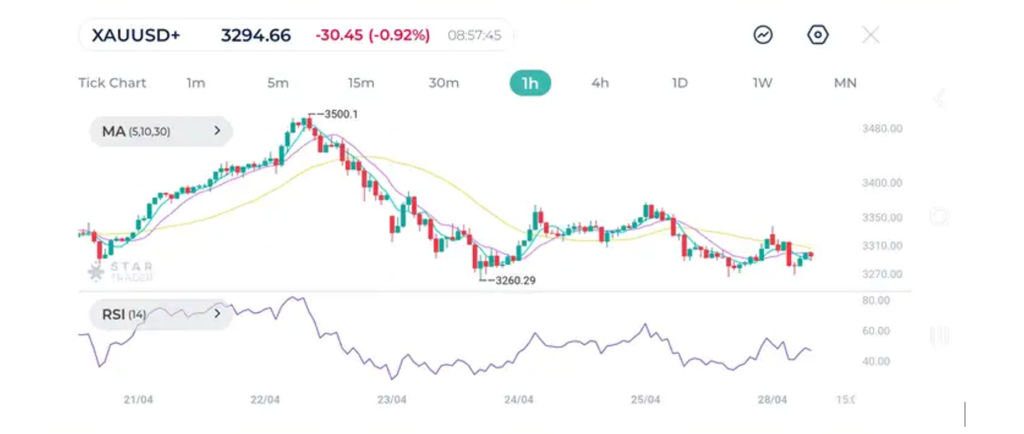
| Resistance | $3,315 | $3,356 | $3,371 |
| Support | $3,269 | $3,260 | $3,226 |
EURUSD shows fluctuations around 1.1400 levels
Following the strong upward movement above 1.1500 levels and breaking 1.1550, EURUSD traded in a tight range between 1.1300 and 1.1400 with RSI showing neutral signs on the hourly chart. A breakout above 1.1400 is recommended before confirming bullish movement on the pair.
EURUSD 1H Chart
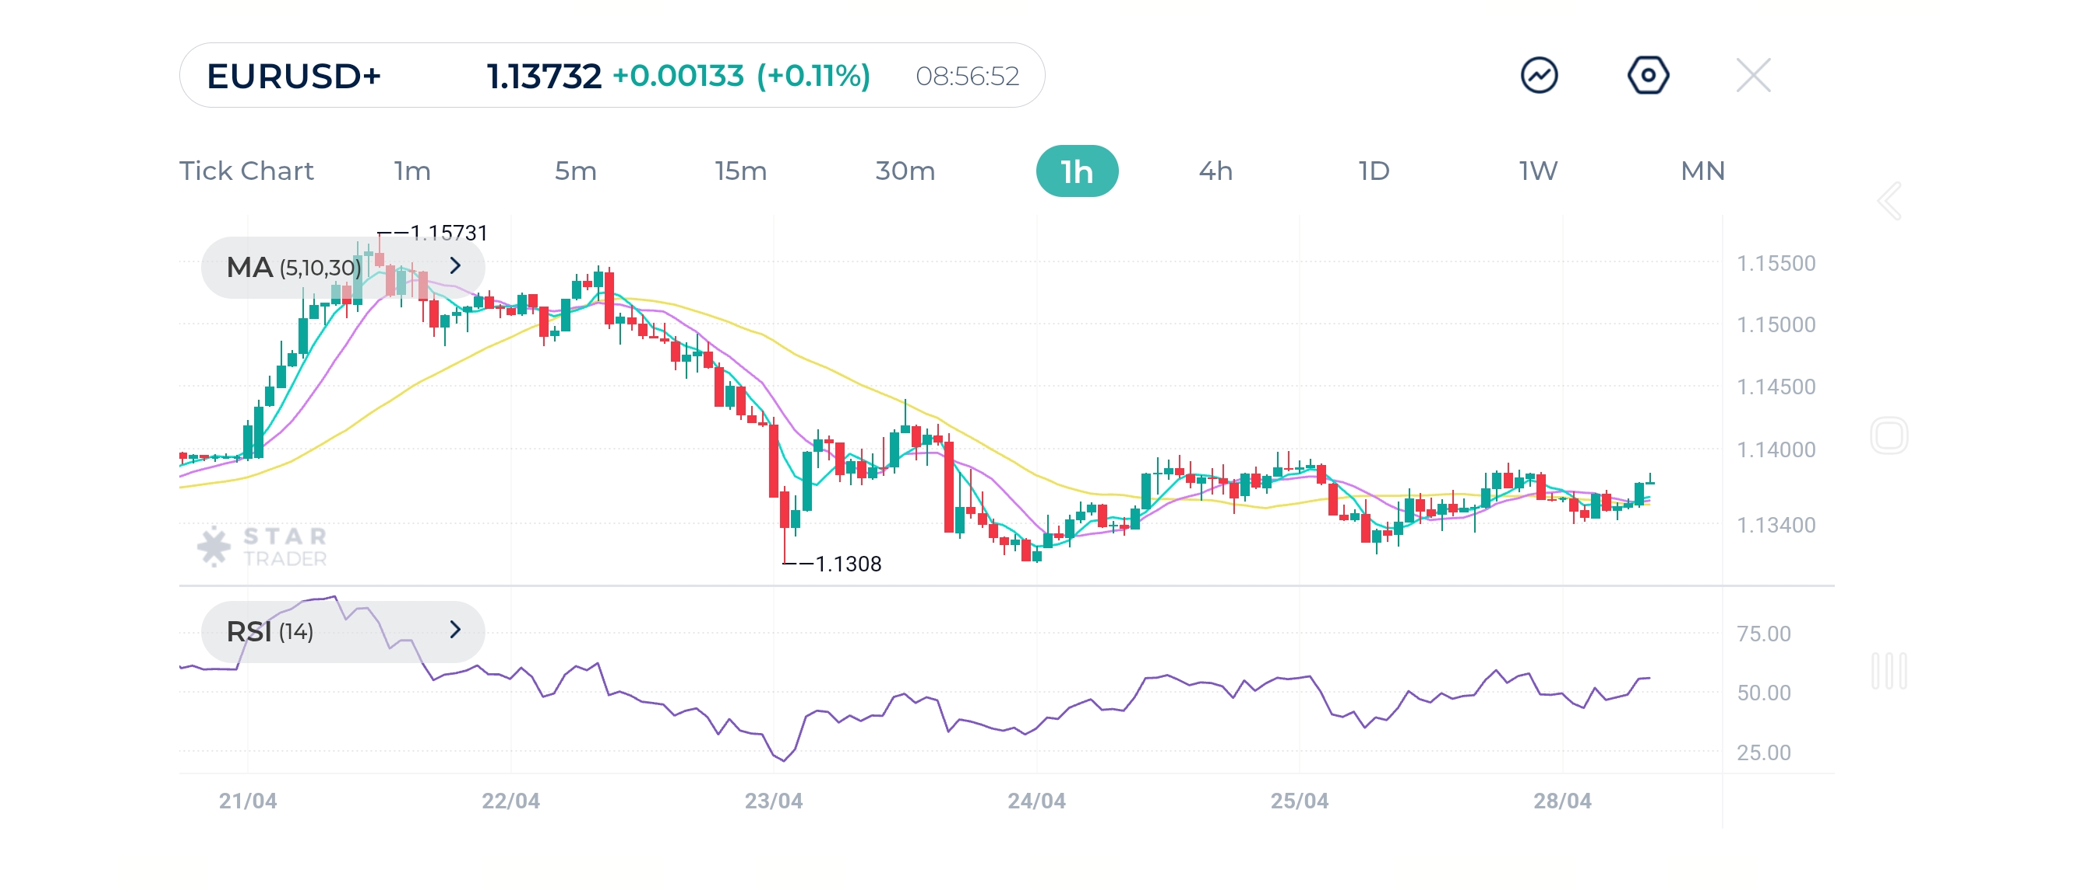
| Resistance | 1.1388 | 1.1422 | 1.1441 |
| Support | 1.1343 | 1.1307 | 1.1265 |
Bitcoin breaks $95,000 as the US Dollar weakens
Bitcoin gained more than 13% since April 20th as the US dollar showed weakness last week. After daily candles break above short term moving averages MA(5) and MA(10), Bitcoin shows small correction with lower volume indicating temporary bearish momentum.
Correction towards $90,000 psychological levels is expected before continuing with the upward trend.
BTCUSD Daily Chart
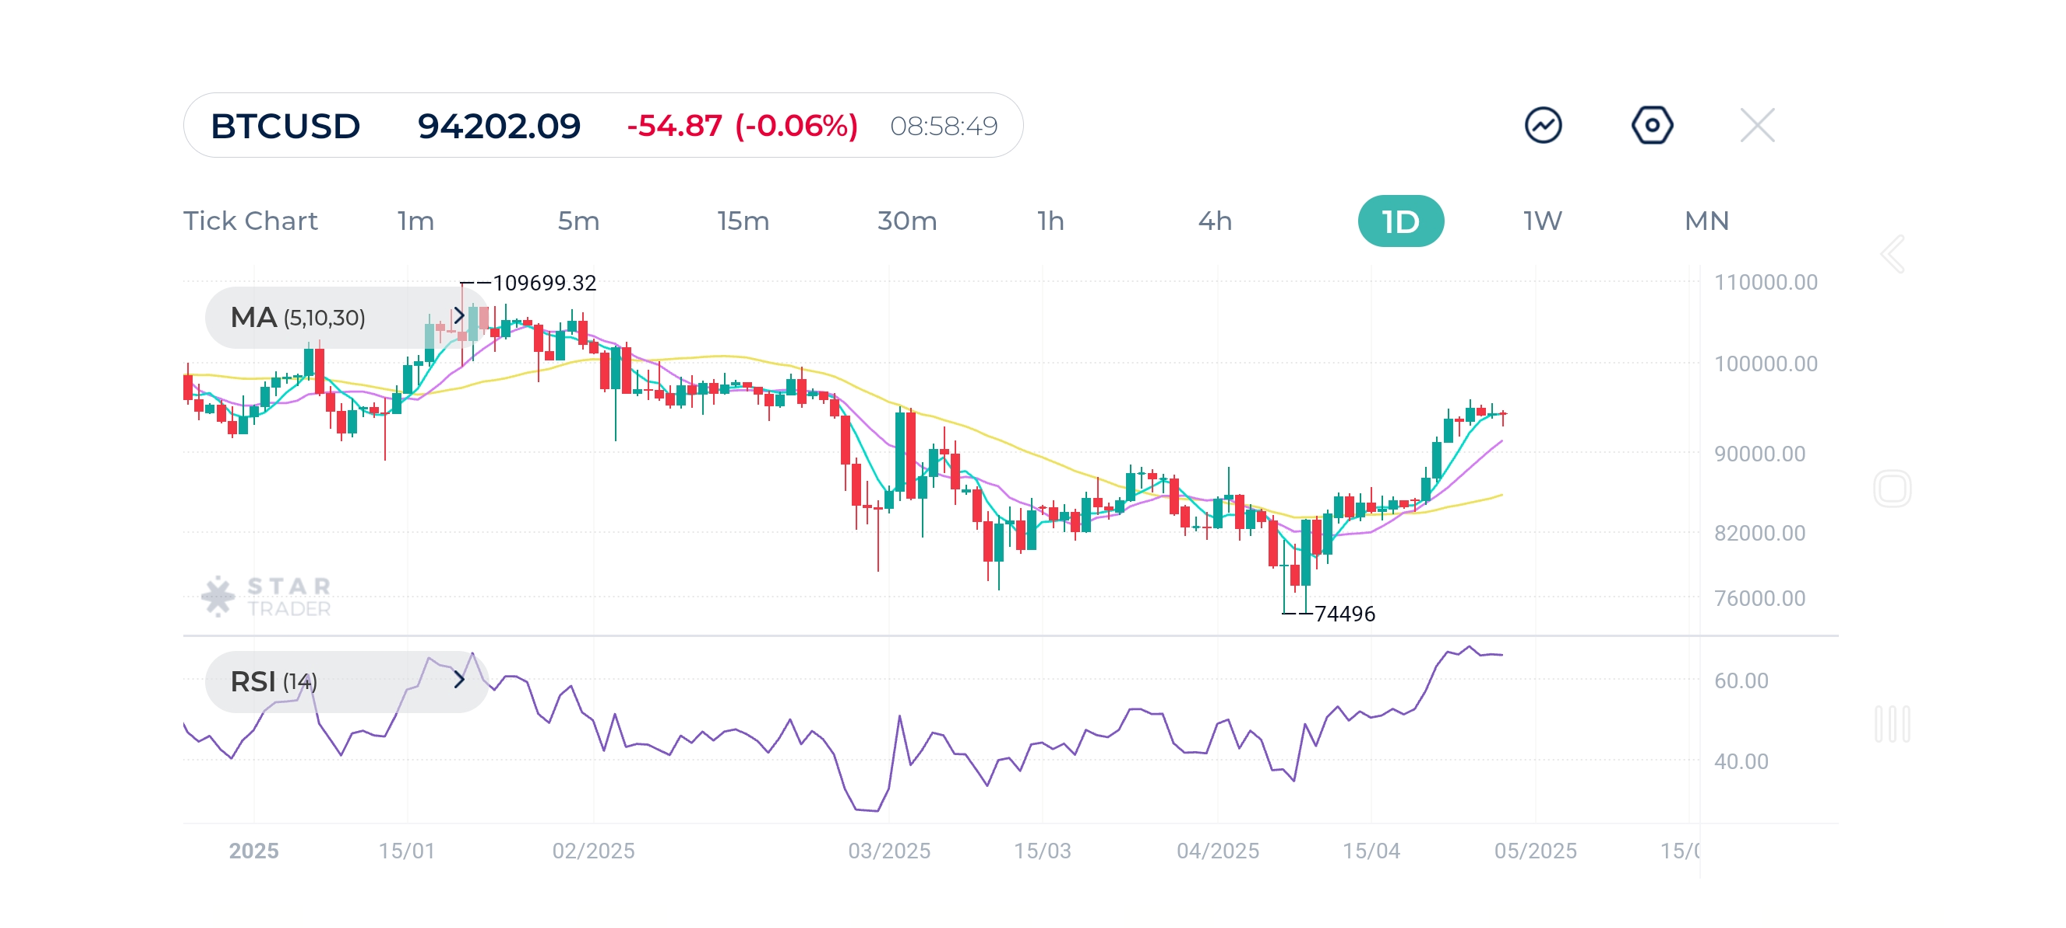
| Resistance | $94,556 | $95,464 | $95,901 |
| Support | $92,843 | $91,750 | $91,200 |
