U.S. Inflation Persist - 100 us dollar tore by monetary policy.
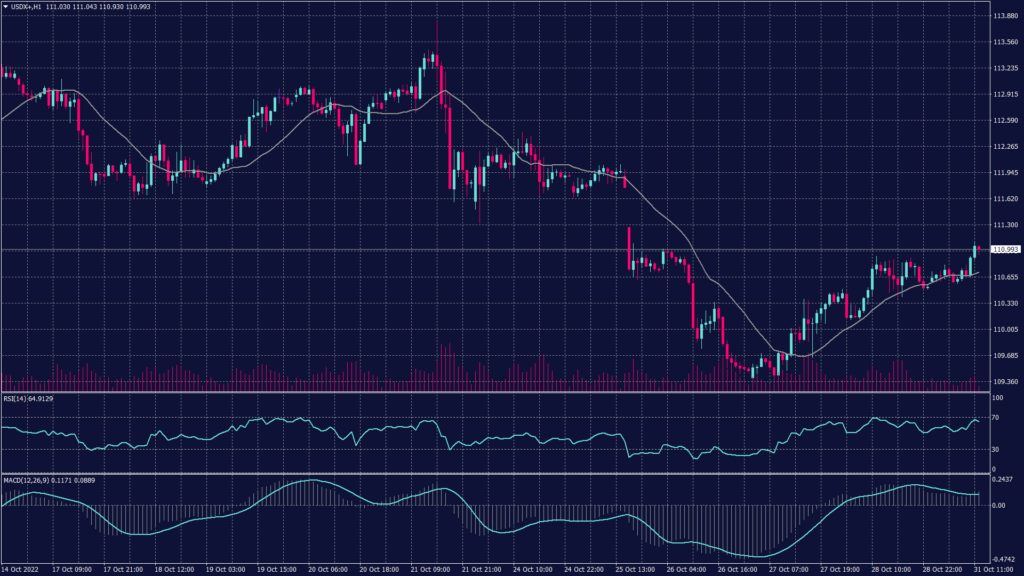
The U.S. dollar edged higher in early European trade at the start of a pivotal week. Meanwhile, the Dollar Index traded 0.3% higher at 110.975, climbing away from last week’s one-month low of 109.53. However, the core PCE index, accelerated in September, suggesting the U.S. central bank still has work to do before it can claim that inflation has been tamed. The Fed is expected to deliver another 75 basis point rate hike after the conclusion of the FOMC meeting on Wednesday.
The dollar had seen some selling last week as expectations grew that signs of economic weakness would result in the Fed pointing to a less aggressive pace of monetary tightening after this week’s increase. A stronger economy will help the Fed carry on aggressive rate hikes to curb the worst U.S. inflation in four decades. Still, some said there appeared to be trouble with the U.S. economy despite its forecast-beating growth in the third quarter, and that could explain gold’s modest losses on Thursday.
| SUPPORT | RESISTANCE |
| 110.30 | 111.10 |
| 110.10 | 111.60 |
| 109.70 | 112.72 |
Sterling Pound fell 0.4% to 1.1564 but is still set for a near 4% gain this month as traders welcomed the appointment of Rishi Sunak as the new U.K. prime minister, easing some of the political and economic uncertainty that his predecessor had unleashed. The Bank of England meets on Thursday and is widely expected to hike interest rates once more as it attempts to combat inflation running at double digits.
The Sterling pound reflects the optimism and confidence of the market but remains not strong enough to gather momentum for an uprise. Technical indicators show neutral readings while Fibonacci retracement shows fluctuations.
| SUPPORT | RESISTANCE |
| 1.1530 | 1.1580 |
| 1.1500 | 1.1620 |
| 1.1470 | 1.1660 |
Gold futures fell 0.4% to $1,638 before the FOMC meeting this week. Markets are still enjoying the hawkish speech Fed members deliver but also investors expect the federal reserves to slow down the hiking game. Spot gold traded last at 1,639 continuing the downtrend and picking more distance from the crucial resistance at 1,700.
Technically, spot gold remains negative on the daily chart and targets $1,620 per ounce with little to no support before that level. Technical indicators show a probability of a horizontal movement or neutral momentum. Meanwhile, the hourly chart shows a continuation in a slow fashion to the downtrend.
| SUPPORT | RESISTANCE |
| 1,630 | 1,639 |
| 1,624 | 1,643 |
| 1,620 | 1,650 |
Oil prices fell over $1 on Monday following weaker-than-expected factory activity data out of China and on concerns, its widening COVID-19 curbs will curtail demand. Brent crude futures dropped 1.2% to $94.67 a barrel, while WTI crude was at $86.83 a barrel down 1.2%. However, both benchmarks are on track for their first monthly gains since May, up 7.7% and 9.3% respectively.
| SUPPORT | RESISTANCE |
| 85.50 | 87.95 |
| 84.90 | 88.70 |
| 84.30 | 89.95 |
EURUSD 1H chart shows downtrend accelerating in recent sessions since the beginning of the week.…
Key Takeaways: GDP numbers in the US show contraction in the economy of 0.3% in…
Dear Valued Clients, To further optimize platform resource allocation and enhance service efficiency, STARTRADER will…
Dear Valued Client, We are writing to inform you of a recent incident involving the…
Swiss Franc falls as USDCHF recovers from its historical lows Following downtrend breakout, USDCHF sets…
Key Takeaways: U.S. Stock Markets close higher on Tuesday on hopes of trade deals between…
This website uses cookies.