


Weekly Technical Analysis: Gold Breaks a New High, and Oil is Back Above $64

EURUSD: Potential Bearish Correction as RSI is in Overbought Territory
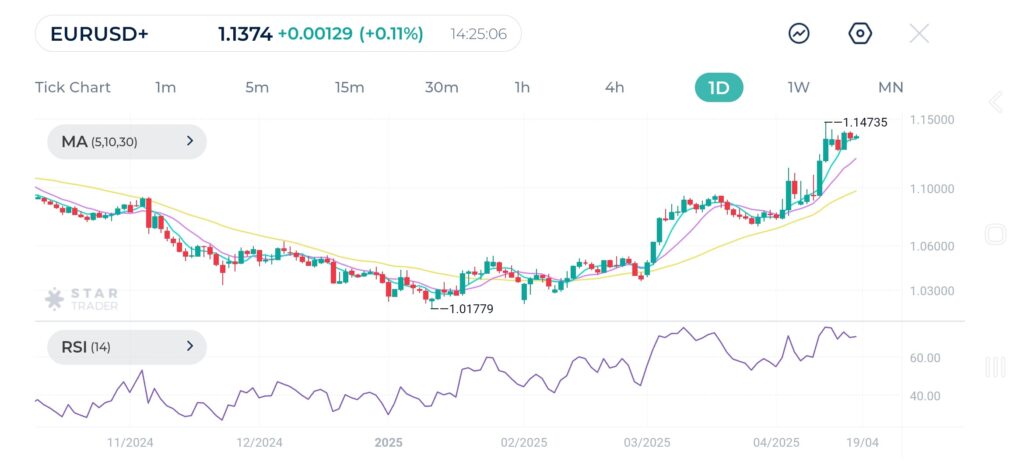
Following a strong uptrend since early February, EURUSD has been trading in a tight range this week. Recent candles show consolidation just below the psychological level of 1.1500. Technicals indicate possible continuation if breakout occurs with high volume above the recent resistance of 1.1473.
The nearest support level is seen at 1.1266 on the daily chart. With RSI in the overbought zone, a downward correction to the aforementioned support level is expected, especially if a bearish divergence is recorded near the current levels. While the upward trend remains strong, breaking below the 1.1266 level might indicate further selling.
EURUSD Daily Chart
Main Support and Resistance Levels:
| Resistance | 1.1411 | 1.1473 | 1.1500 |
| Support | 1.1340 | 1.1264 | 1.1194 |
XAUUSD: Minor Consolidation at the High of the Trend, Support from Moving Averages
XAUUSD 4-Hour Chart
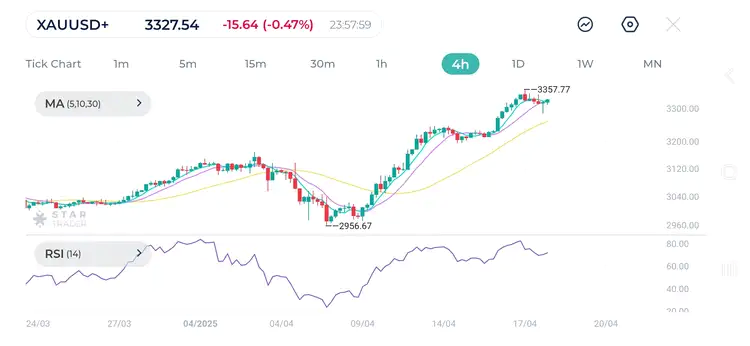
Gold continues its upward trend as it records higher highs and higher lows. Short-term and mid-term moving averages are trending upwards. Price has just tested the MA 10 and bounced back, suggesting the uptrend is still active and supported by dynamic support.
RSI has reached overbought territory, suggesting some downward correction is expected. Moving Average (MA30) is a potential next dynamic support level. However, no bearish reversal candlesticks are yet seen at the top of the trend. A break and 4H candle close above $3357.77 could push price toward the next resistance level of $3400 (psychological level)
Main Support and Resistance Levels:
| Resistance | $3,342 | $3,357 | $3,400 |
| Support | $3,284 | $3,211 | $3,188 |
USOUSD: Potential Bearish Correction as RSI is in Overbought Territory
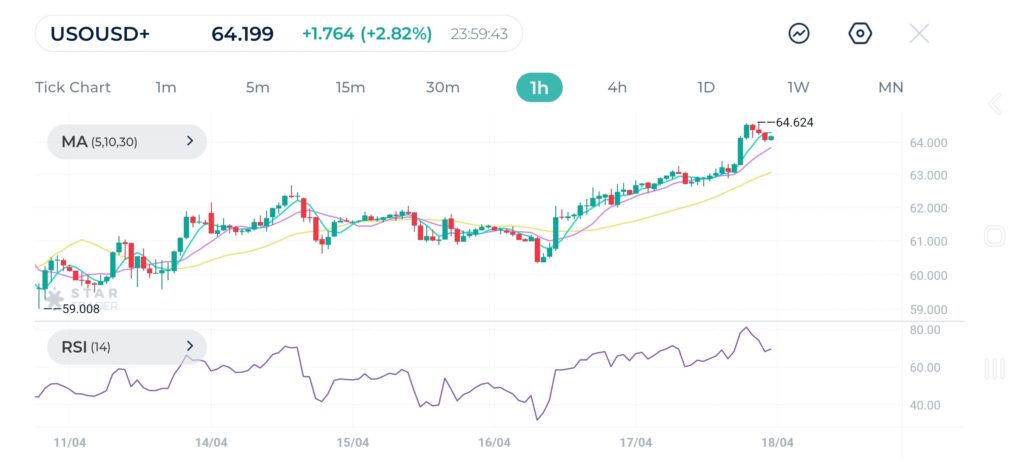
Oil shows strong bullish momentum starting from around $59.00 to a recent high of $64.62 with clear series of higher highs and higher lows. Short-term and mid-term moving averages (MA 5, 10, 30) are aligned with the uptrend. RSI fell slightly recently, indicating cooling off in buying pressure, suggesting a brief consolidation or minor retracement may follow.
Breaking above resistance level of $64.62 with strong volume indicates further upward movement towards $65.50 and $66.20.
USOUSD 1-Hour Chart
Main Support and Resistance Levels:
| Resistance | $64.14 | $64.62 | $65.04 |
| Support | $62.39 | $62.13 | $61.50 |
